
Shopify, for Switzerland
Shopify Statistics Switzerland 2026
Shopify statistics for Switzerland: our page-one study of 28 queries, the global figures that pass a source test, and the Swiss numbers no one publishes.
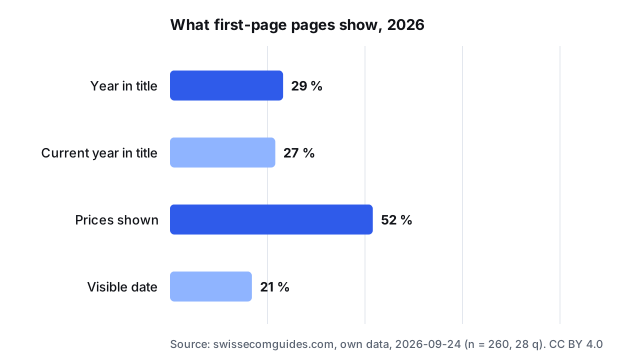
The short version: This page treats every Shopify statistic as a measuring instrument: usable only when it names a source, a date and a counting method. Our page-one study fetched 260 of 270 results for 28 Shopify and Swiss e-commerce queries on 24 September 2026. The most striking gap: 52% of pages showed prices, but only 21% showed a visible date, so half the numbers you meet cannot be tied to any moment in time. The figures that pass a primary-source test are global. Statista puts Shopify's share of the worldwide e-commerce technology market at 10.8% and its quarterly GMV at 116bn USD (both 2025). No primary source publishes Swiss GMV, a Swiss store count or a Swiss average order value. Any page quoting those for Switzerland has borrowed a global figure.
A statistic without its method is not simplified data. It is invention with a decimal point. On Swiss questions the honest answer is usually that no usable figure exists yet, because Shopify reports worldwide and Swiss offices do not split by platform.
This page collects the numbers that survive a source test and names the ones nobody publishes. If you are budgeting a store rather than a spreadsheet, the franc figures sit in our Shopify Switzerland setup guide.
What ranks on Google for shopify: our page-one study
We ran the search ourselves. On 24 September 2026 we collected the page-one results for 28 queries spanning Shopify statistics and Swiss e-commerce questions: 270 results in all.
-
260 — page-one results fetched from 270 collected across 28 queries; 10 blocked (n = 260, our page-one study, 24 September 2026).
-
52% — of fetched pages showed prices; only 21% carried a visible date (n = 260).
-
29% — of titles carried a year, and only 27% the current year (n = 270).
-
15% — of fetched pages included a comparison table; 7% an FAQ block (n = 260).
-
1,831 — median words per page; a quarter ran under 788 words, a quarter over 2,961 (n = 259).
-
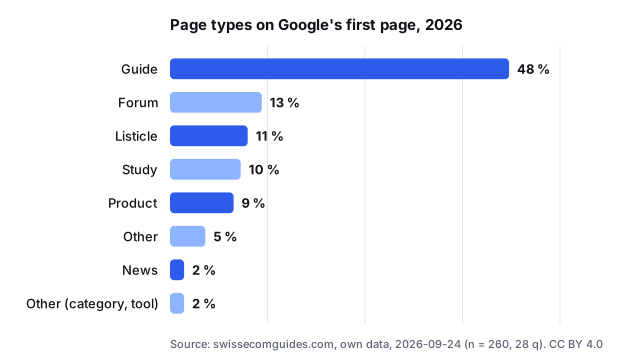
48% — of fetched pages were guides, ahead of 13% forum threads, 11% listicles and 10% studies (n = 260). By domain, shopify.com held 35 of the 270 positions, help.shopify.com 26 and reddit.com 18, spread across 118 distinct domains.
| Query | Year in title | Prices shown | Median words | Top page type |
|---|---|---|---|---|
| shopify statistics 2026 | 100% | 80% | 2,479 | guide |
| shopify statistics | 70% | 70% | 2,479 | listicle |
| ecommerce statistics Switzerland 2026 | 60% | 60% | 1,717 | study |
| how many online stores are there in Switzerland | 10% | 70% | 1,981 | guide |
| shopify cost switzerland | 50% | 75% | 3,410 | guide |
| swiss shopify store first year cost | 44% | 89% | 3,499 | guide |
Each row covers 10 page-one results, except shopify cost switzerland (n = 8).
Our take: The Swiss-flavoured queries are the weakest served. "How many online stores are there in Switzerland" returns pages where 1 title in 10 carries a year, which is exactly where undated numbers thrive. Our call: trust this study for search behaviour, and demand a date from every borrowed figure before it enters a budget.
The cost queries rank long guides, medians near 3,400 words, with prices on most pages. What those costs amount to in francs, card and TWINT rates included, is our Swiss cost breakdown; the setup guide covers the store itself.
The Shopify statistics that pass a source test
Four figures survive. Each names its publisher and year, and none describes Switzerland. Even a heavily documented number, such as the cart abandonment rates the Baymard Institute compiled in 2026, moves with the counting method. The method line matters more than the magnitude.
- 10.8% — Shopify's share of the global e-commerce technology market as of 2026 (Statista's Shopify topic page, 2025). The "roughly ten percent" you see quoted is this figure, rounded.
- 116bn USD — quarterly Gross Merchandise Volume (Statista, 2025). For the annual figure the primary source is Shopify's own full-year 2025 release: a company statement, in USD, worldwide only.
- 1,035 thousand — Shopify online stores in the United States as of September 2025 (Statista, 2025). It is the only country split we found. No Swiss count exists.
- USPS — the leading shipping carrier used by Shopify stores as of September 2025 (Statista, 2025). That is an American parcel fact. It says nothing about Swiss Post or the border.
- 2.8 million — monthly downloads of the Shop app worldwide (Statista, 2025), global again for the same reason.
Two more figures, dated but global. Shopify's Q2 2026 release states 30%+ growth across GMV, revenue, gross profit and free cash flow, a company statement about itself rather than an audit.
What no source publishes for Switzerland
Three questions have no published answer. What share of Switzerland's e-commerce runs through Shopify? What is the GMV of Swiss Shopify merchants? Where does Switzerland rank by store count? Statista counts stores country by country for some markets and stops there. The U.S. Census Bureau publishes a quarterly e-commerce report for its own economy; Switzerland has no equivalent platform split, and we found none while compiling this page.
Total store counts fare no better. Third-party estimates count registered domains, a method that includes abandoned trials and closed shops. Active stores are a range, not a point. Shopify Plus counts, Swiss average order values and payment adoption fall in the same gap: published by nobody, quoted anyway.
Payments tell the same story. The TWINT share at Swiss checkouts is documented per store, not in any statistic. Our TWINT checkout guide sets out what the documentation confirms and how to check your own setup.
Definitions trip Swiss readers twice. MWST/TVA is not EU VAT: the Federal Tax Administration (ESTV/AFC) registers you at CHF 100,000 of worldwide annual turnover, which our legal pages guide explains. Sell into the EU and the European Commission's One Stop Shop page governs the other side. Same word, two regimes, two sets of figures.
So the skip rule follows: if a figure fails one check, treat it as decoration.
Our three-check rule, for reuse:
- Named source: who measured it, with a link that resolves.
- As-of date: when the measurement stopped.
- Swiss definition: does it describe Switzerland, or a global total dressed as one?
How we counted
Page-one results, 10 per query, for 28 queries, fetched on 24 September 2026 through our hub search layer. Each page was classified by type and measured for word count, year in title, prices shown and visible date. Ten blocked or unknown fetches are excluded from the page-level rates. We publish a figure only where at least 8 pages were measured, which is why every row in the query table can stand behind its sample.
Previous years
This is the first edition, 2026. The 2027 refresh moves these figures down here and adds that year's study.
Sources
- Statista, Shopify – statistics & facts — checked on 24 September 2026.
- Shopify, Shopify Delivers Big: 30%+ Growth Across GMV, Revenue, Gross Profit, and Free Cash Flow (Q2 2026 results) — checked on 24 September 2026.
- Shopify, Shopify's Standout 2025: The Launchpad for a New Era of Commerce in 2026 (Q4 and full-year 2025 results) — checked on 24 September 2026.
- U.S. Census Bureau, Quarterly Retail E-Commerce Sales Report, 2Q 2026 — checked on 24 September 2026.
- Baymard Institute, 50 Cart Abandonment Rate Statistics 2026 — checked on 24 September 2026.
- European Commission, VAT One Stop Shop – VAT e-Commerce – One Stop Shop — checked on 24 September 2026.
Download the data
The aggregates on this page are Swiss Ecom Guides's own data (never per-product prices or third-party text). Each file carries the snapshot date, the sample size and the method.
Licence CC BY 4.0: you may reuse these figures and charts by crediting Swiss Ecom Guides with a link to this page.